
There are countless applications for process Raman spectroscopy. MarqMetrix Application Specialist, Bharat Mankani, PhD. takes us through an exciting Raman application in the food & beverage industry: the compositional analysis of wine and other alcoholic beverages for quality purposes.
By measuring several varieties of wine, we get a great snapshot of Raman’s capabilities as a quality assurance tool. Plus, we can learn some really interesting information about wine production and wine varieties. All compositional data in this post and video was collected with the MarqMetrix® All-In-One Process Raman System and two probes: the MarqMetrix immersion BallProbe®, and FlowCell™.
Compositional Analysis: Sugar Content
One of the more useful pieces of compositional information for wine is sugar content. From this data, winemakers can derive information about fermentation and key flavor components by understanding their wine’s sugar content. In this example, we analyzed riesling and chardonnay. The riesling spectrum showed high sugar peaks when compared to the less sugary chardonnay sample.
From the video, and the chart below, we can see that the MarqMetrix All-In-One provides quick and accurate compositional information about the sugars found in different wines.
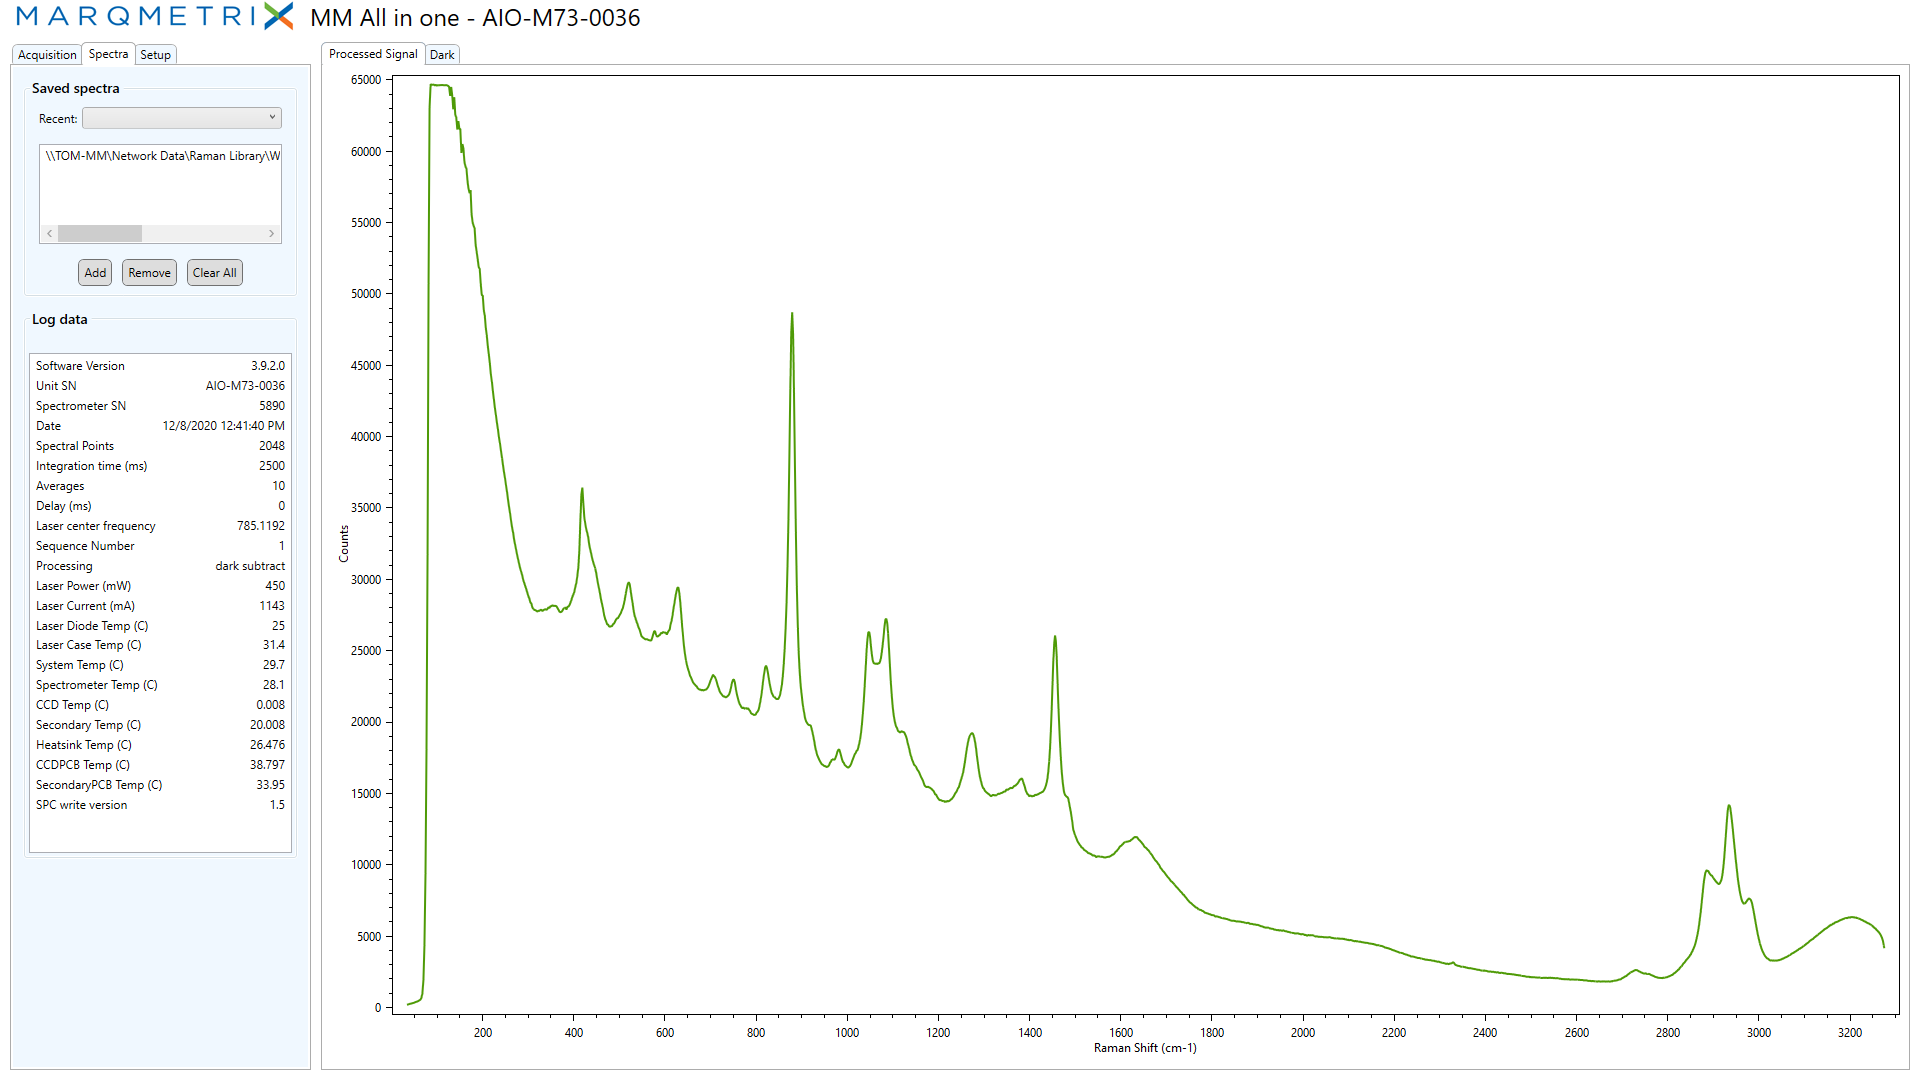
Riesling spectrum: Note the collection of peaks from wavenumbers 400-800. These peaks represent different complex sugars in the wine.
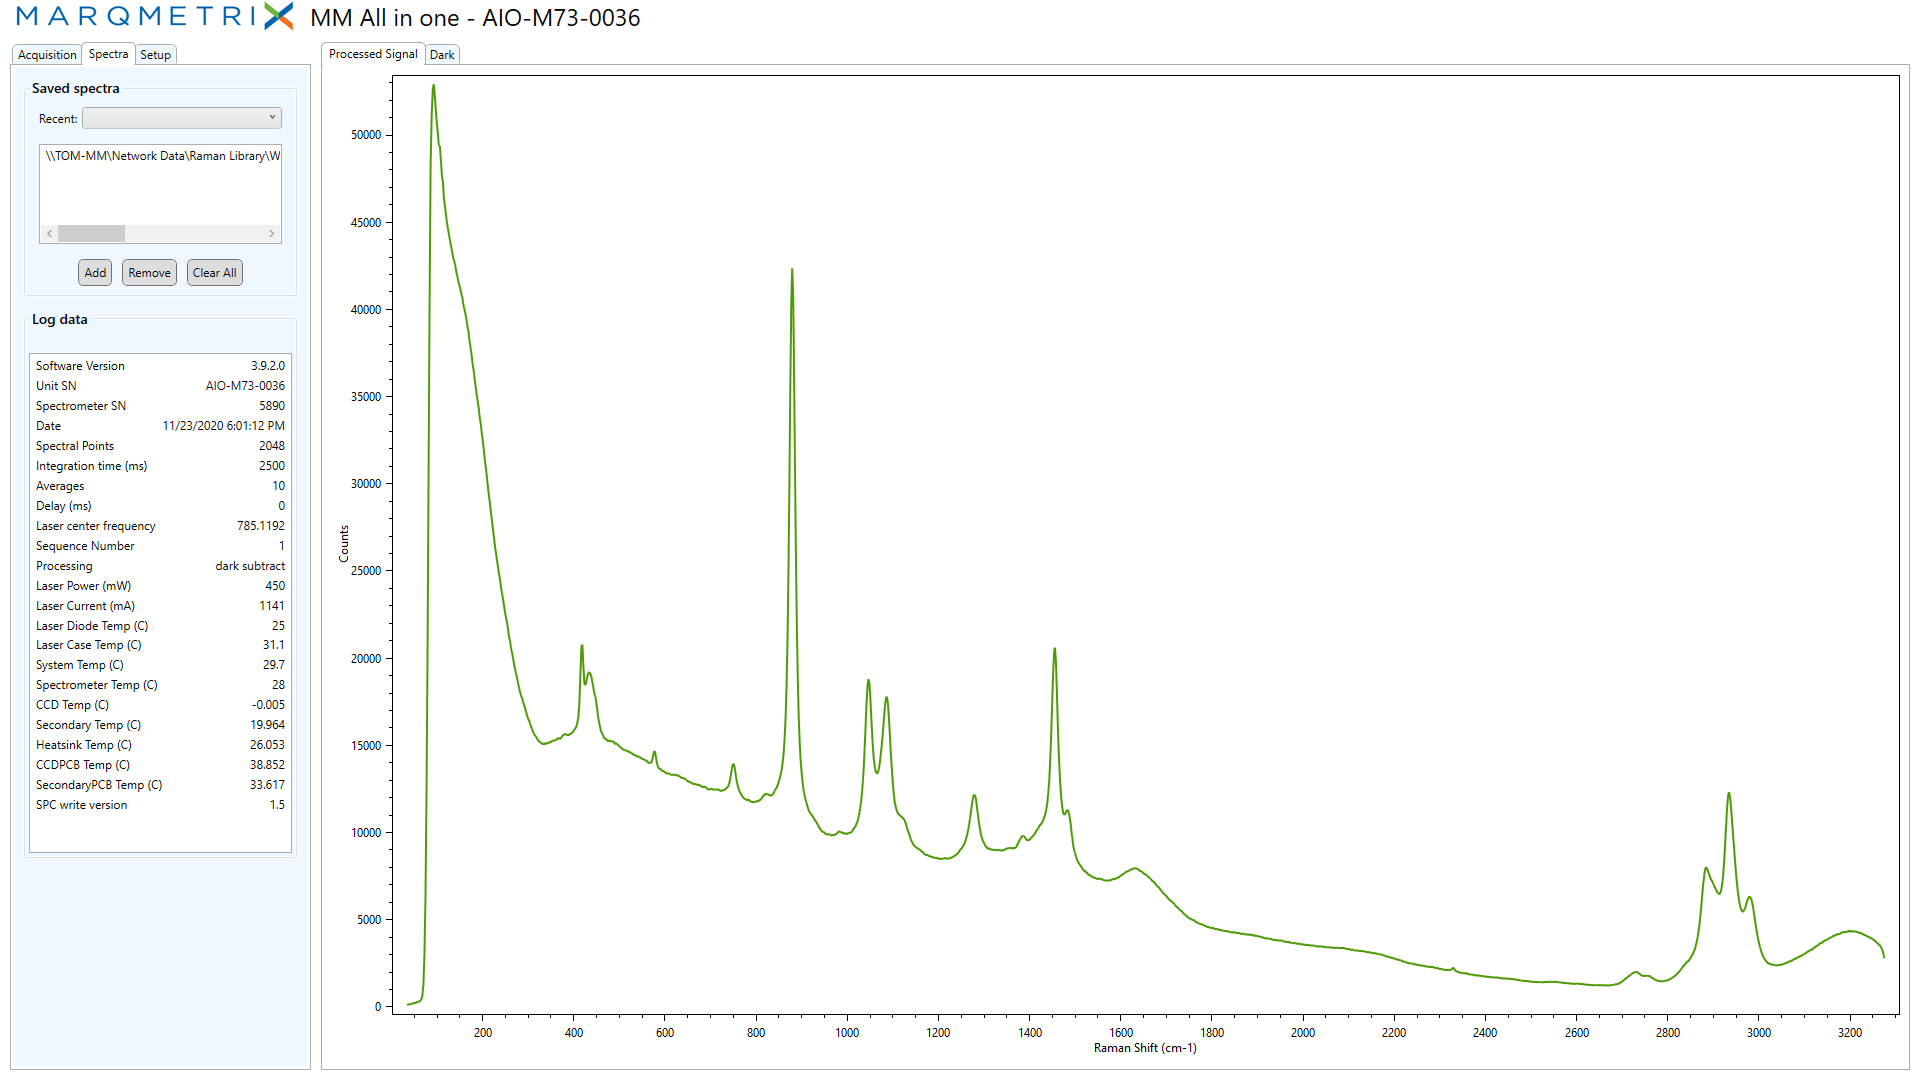
Chardonnay spectrum: Note the lack of peaks in the same range (400-800).
Compositional Analysis: Alcohol Percentage
Another important aspect of wine production is the ability to assess the alcohol content of your wine accurately. You can see alcohol content peaks for both sake and vodka (alcohol diluted in water) in the spectra below. Ethanol produces a strong Raman signal, making it very easy to see in all of our different spectra of wine.
By comparing the spectra of an unknown wine to a known standard alcohol, we can use process Raman to determine alcohol percentage in seconds.
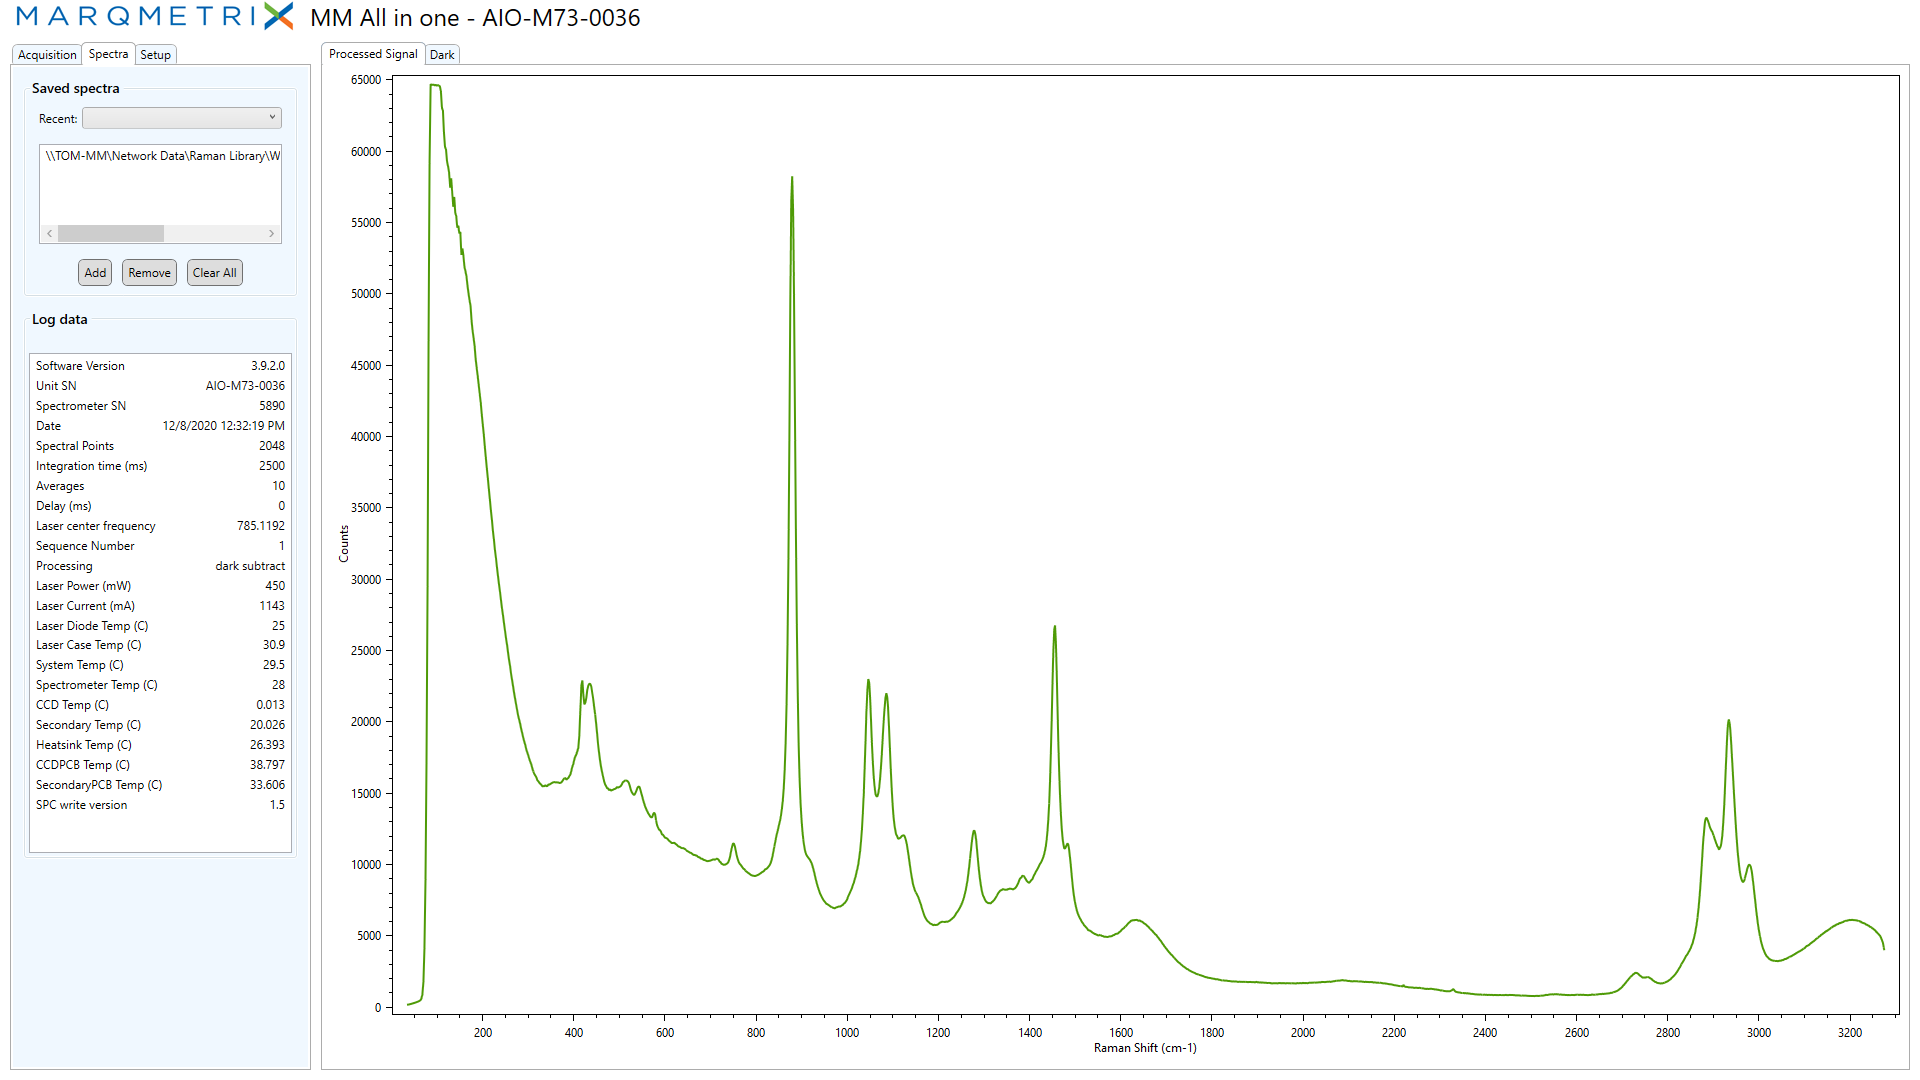
Sake spectrum: The peak near 1500 wavenumbers is significantly more intense than some other varieties measured, due to higher alcohol percentage.
Compositional Analysis: Measuring Fizz
We can also use Raman to measure the presence of carbonation in sparkling wines, such as prosecco. This is an important data point for sparkling wine producers who are trying to avoid sending out flat bottles of bubbly. With the MarqMetrix All-In-One, measuring carbonation is incredibly easy, quick, and accurate.
Below is a comparison of carbonation in prosecco (present) and chardonnay (not present).
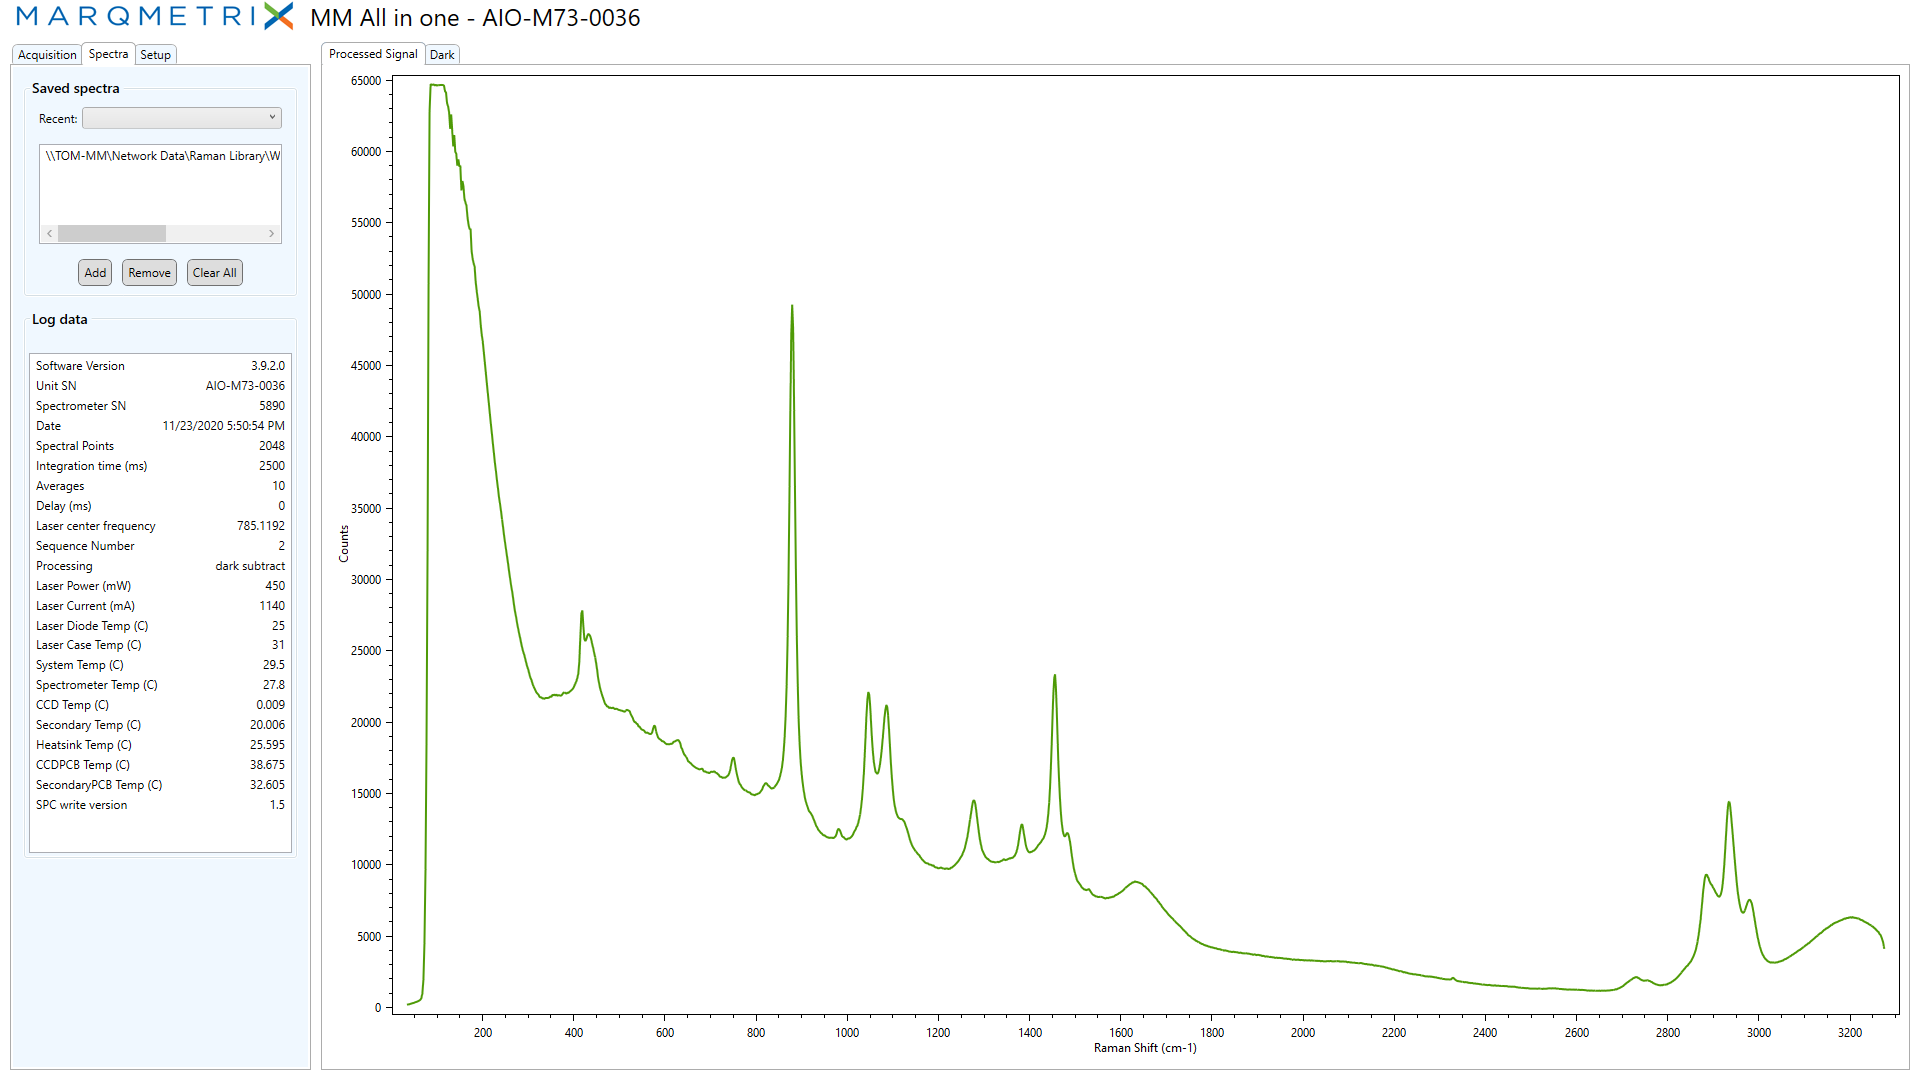
Prosecco spectrum: There is a small peak at wavenumber 1400 that shows the presence of CO2, this same peak is not present in the non-carbonated chardonnay spectrum.
Chardonnay spectrum: Notice there is no peak at 1400 wavenumbers, due to the lack of carbonation in the wine.
Quality Control with No Sample Prep
Perhaps the best thing about all of this compositional information is that Raman is completely non-destructive and requires no sample prep. We conducted this entire experiment by simply opening the bottles and using a MarqMetrix BallProbe. The compositional analysis of wine is just one of the various data-rich applications for Raman spectroscopy.
This blog will continue to feature other applications in the near future, so keep checking back for more interesting content.
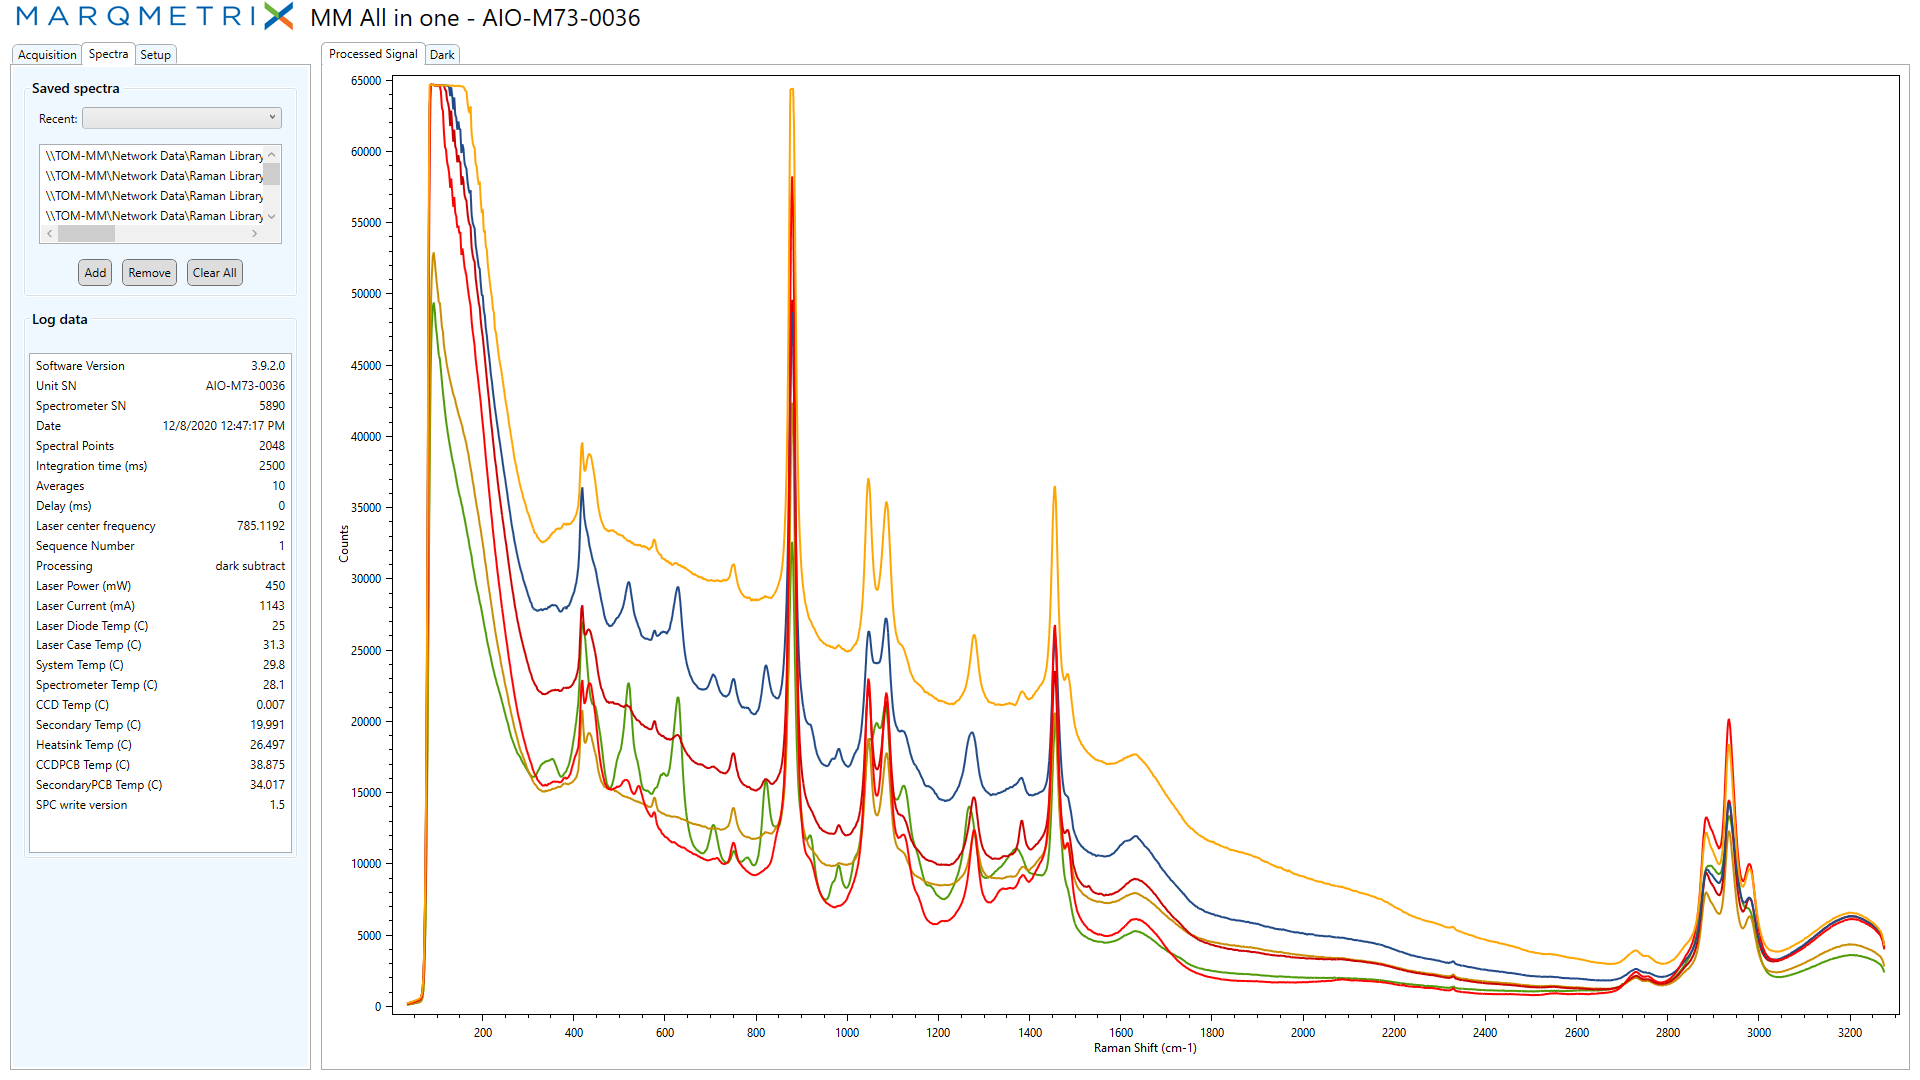
The spectra of five wines and an ethanol solution (in yellow) overlaid.